
云原生训练营 -Week10
作者:jjn0703
- 2022 年 4 月 24 日
本文字数:4469 字
阅读完需:约 15 分钟
1. 为 HTTPServer 添加 0-2 秒的随机延时;
2. 为 HTTPServer 项目添加延时 Metric;
3. 将 HTTPServer 部署至测试集群,并完成 Prometheus 配置;
4. 从 Promethus 界面中查询延时指标数据;
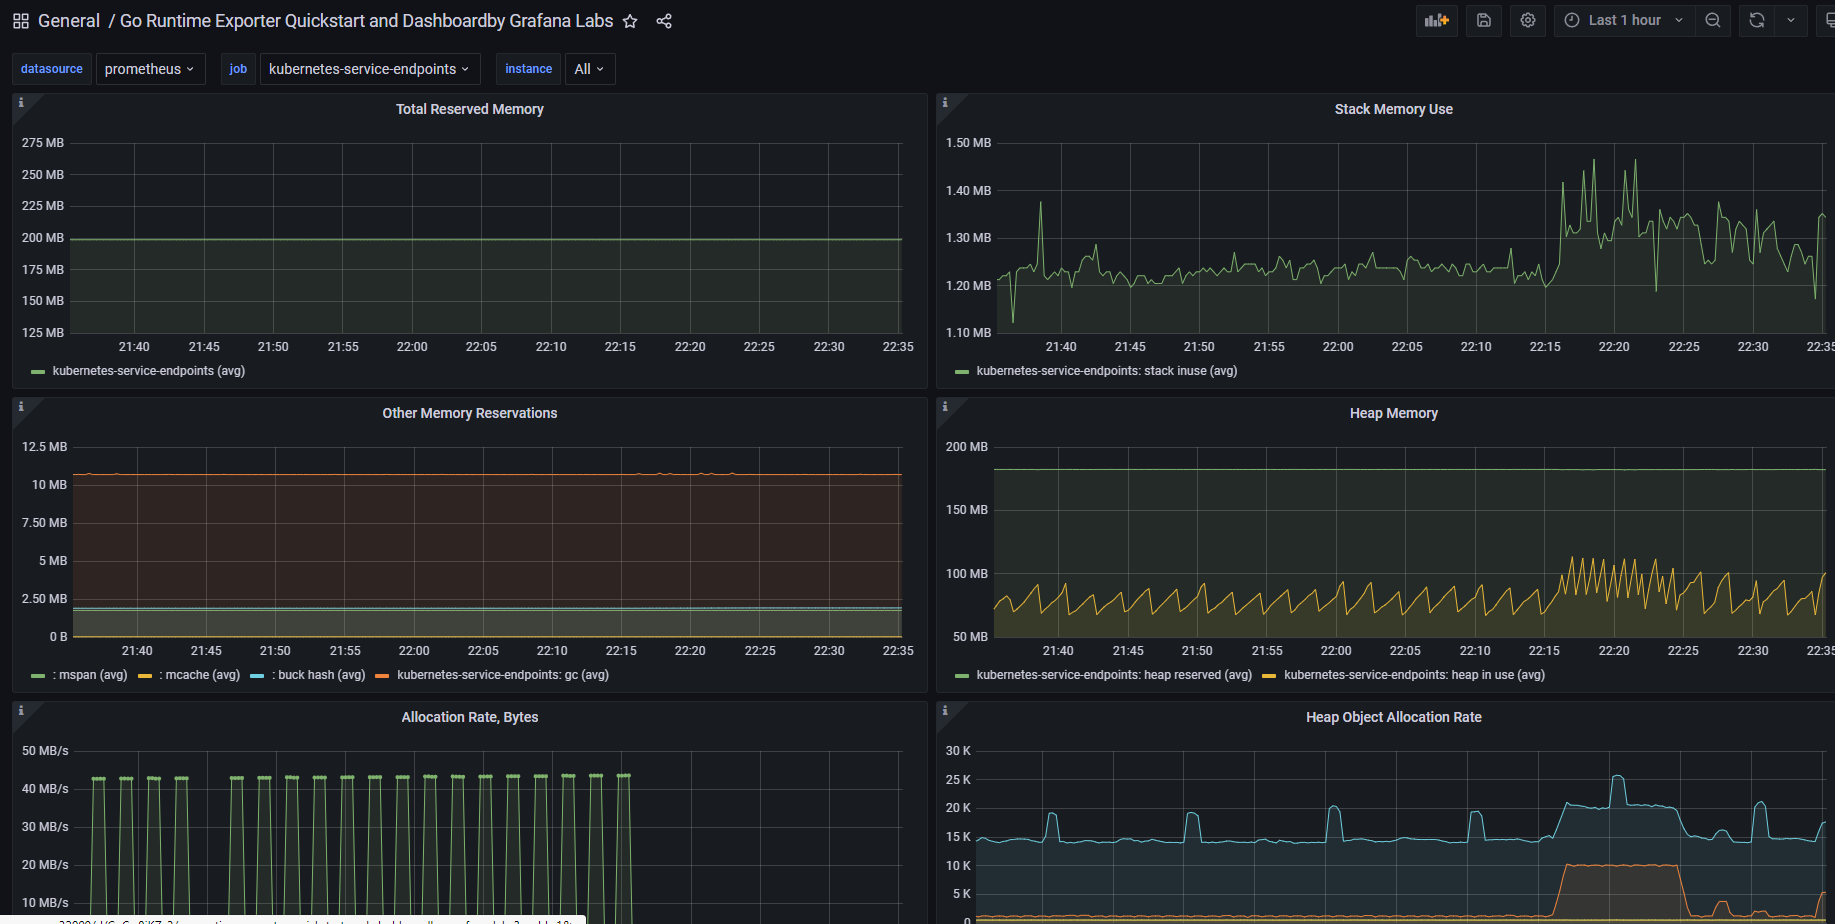
5. (可选)创建一个 Grafana Dashboard 展现延时分配情况。
1. 为 HTTPServer 添加 0-2 秒的随机延时
添加 controller
package controller
import (	"fmt"	"httpserver/utils/metrics"	"math/rand"	"net/http"	"time")
func registerImagesRoutes() {	http.HandleFunc("/images", handleImages)}
// 添加 0-2 秒的随机延时func handleImages(w http.ResponseWriter, r *http.Request) {	timer := metrics.NewTimer()	defer timer.ObserveTotal()	randInt := rand.Intn(2000)	time.Sleep(time.Millisecond * time.Duration(randInt))	w.Write([]byte(fmt.Sprintf("<h1>%d<h1>", randInt)))}
复制代码
注册路由
package controller
// RegisterRoutes ...func RegisterRoutes() {	registerImagesRoutes()}
复制代码
运行测试
curl curl http://localhost:8888/images复制代码
多请求几次,会输出不同的延迟数
<h1>81<h1><h1>1887<h1><h1>59<h1>复制代码
2. 为 HTTPServer 项目添加延时 Metric
自定义 metrics,参考自 https://github.com/kubernetes/autoscaler/blob/master/vertical-pod-autoscaler/pkg/utils/metrics/metrics.go
package metrics
import (	"fmt"	"github.com/prometheus/client_golang/prometheus"	"time")
func Register() {	err := prometheus.Register(functionLatency)	if err != nil {		fmt.Println(err)	}}
const (	MetricsNamespace = "cloudnative")
func NewTimer() *ExecutionTimer {	return NewExecutionTimer(functionLatency)}
var (	functionLatency = CreateExecutionTimeMetric(MetricsNamespace, "Time spent."))
func NewExecutionTimer(histo *prometheus.HistogramVec) *ExecutionTimer {	now := time.Now()	return &ExecutionTimer{histo: histo, start: now, last: now}}
func (t *ExecutionTimer) ObserveTotal() {	(*t.histo).WithLabelValues("total").Observe(time.Now().Sub(t.start).Seconds())}
func CreateExecutionTimeMetric(namespace string, help string) *prometheus.HistogramVec {	return prometheus.NewHistogramVec(		prometheus.HistogramOpts{			Namespace: namespace,			Name:      "execution_latency_seconds",			Help:      help,			Buckets:   prometheus.ExponentialBuckets(0.001, 2, 15),		}, []string{"step"},	)}
type ExecutionTimer struct {	histo *prometheus.HistogramVec	start time.Time	last  time.Time}
复制代码
添加路由处理
package controller
import (	"github.com/prometheus/client_golang/prometheus/promhttp"	"net/http")
func registerMetricsRoutes() {	http.Handle("/metrics", promhttp.Handler())}
复制代码
注册路由
package controller
// RegisterRoutes ...func RegisterRoutes() {	registerMetricsRoutes()}
复制代码
测试
~ curl http://localhost:8888/metrics# HELP go_gc_duration_seconds A summary of the pause duration of garbage collection cycles.# TYPE go_gc_duration_seconds summarygo_gc_duration_seconds{quantile="0"} 0go_gc_duration_seconds{quantile="0.25"} 0go_gc_duration_seconds{quantile="0.5"} 0go_gc_duration_seconds{quantile="0.75"} 0go_gc_duration_seconds{quantile="1"} 0go_gc_duration_seconds_sum 0go_gc_duration_seconds_count 0# HELP go_goroutines Number of goroutines that currently exist.# TYPE go_goroutines gaugego_goroutines 8# HELP go_info Information about the Go environment.# TYPE go_info gaugego_info{version="go1.16"} 1# HELP go_memstats_alloc_bytes Number of bytes allocated and still in use.# TYPE go_memstats_alloc_bytes gaugego_memstats_alloc_bytes 774792# HELP go_memstats_alloc_bytes_total Total number of bytes allocated, even if freed.# TYPE go_memstats_alloc_bytes_total countergo_memstats_alloc_bytes_total 774792# HELP go_memstats_buck_hash_sys_bytes Number of bytes used by the profiling bucket hash table.# TYPE go_memstats_buck_hash_sys_bytes gaugego_memstats_buck_hash_sys_bytes 5530# HELP go_memstats_frees_total Total number of frees.# TYPE go_memstats_frees_total countergo_memstats_frees_total 151# HELP go_memstats_gc_cpu_fraction The fraction of this program's available CPU time used by the GC since the program started.# TYPE go_memstats_gc_cpu_fraction gaugego_memstats_gc_cpu_fraction 0# HELP go_memstats_gc_sys_bytes Number of bytes used for garbage collection system metadata.# TYPE go_memstats_gc_sys_bytes gaugego_memstats_gc_sys_bytes 1.981088e+06# HELP go_memstats_heap_alloc_bytes Number of heap bytes allocated and still in use.# TYPE go_memstats_heap_alloc_bytes gaugego_memstats_heap_alloc_bytes 774792# HELP go_memstats_heap_idle_bytes Number of heap bytes waiting to be used.# TYPE go_memstats_heap_idle_bytes gaugego_memstats_heap_idle_bytes 1.916928e+06# HELP go_memstats_heap_inuse_bytes Number of heap bytes that are in use.# TYPE go_memstats_heap_inuse_bytes gaugego_memstats_heap_inuse_bytes 2.048e+06# HELP go_memstats_heap_objects Number of allocated objects.# TYPE go_memstats_heap_objects gaugego_memstats_heap_objects 3572# HELP go_memstats_heap_released_bytes Number of heap bytes released to OS.# TYPE go_memstats_heap_released_bytes gaugego_memstats_heap_released_bytes 1.916928e+06# HELP go_memstats_heap_sys_bytes Number of heap bytes obtained from system.# TYPE go_memstats_heap_sys_bytes gaugego_memstats_heap_sys_bytes 3.964928e+06# HELP go_memstats_last_gc_time_seconds Number of seconds since 1970 of last garbage collection.# TYPE go_memstats_last_gc_time_seconds gaugego_memstats_last_gc_time_seconds 0# HELP go_memstats_lookups_total Total number of pointer lookups.# TYPE go_memstats_lookups_total countergo_memstats_lookups_total 0# HELP go_memstats_mallocs_total Total number of mallocs.# TYPE go_memstats_mallocs_total countergo_memstats_mallocs_total 3723# HELP go_memstats_mcache_inuse_bytes Number of bytes in use by mcache structures.# TYPE go_memstats_mcache_inuse_bytes gaugego_memstats_mcache_inuse_bytes 18688# HELP go_memstats_mcache_sys_bytes Number of bytes used for mcache structures obtained from system.# TYPE go_memstats_mcache_sys_bytes gaugego_memstats_mcache_sys_bytes 32768# HELP go_memstats_mspan_inuse_bytes Number of bytes in use by mspan structures.# TYPE go_memstats_mspan_inuse_bytes gaugego_memstats_mspan_inuse_bytes 37944# HELP go_memstats_mspan_sys_bytes Number of bytes used for mspan structures obtained from system.# TYPE go_memstats_mspan_sys_bytes gaugego_memstats_mspan_sys_bytes 49152# HELP go_memstats_next_gc_bytes Number of heap bytes when next garbage collection will take place.# TYPE go_memstats_next_gc_bytes gaugego_memstats_next_gc_bytes 4.473924e+06# HELP go_memstats_other_sys_bytes Number of bytes used for other system allocations.# TYPE go_memstats_other_sys_bytes gaugego_memstats_other_sys_bytes 966806# HELP go_memstats_stack_inuse_bytes Number of bytes in use by the stack allocator.# TYPE go_memstats_stack_inuse_bytes gaugego_memstats_stack_inuse_bytes 229376# HELP go_memstats_stack_sys_bytes Number of bytes obtained from system for stack allocator.# TYPE go_memstats_stack_sys_bytes gaugego_memstats_stack_sys_bytes 229376# HELP go_memstats_sys_bytes Number of bytes obtained from system.# TYPE go_memstats_sys_bytes gaugego_memstats_sys_bytes 7.229648e+06# HELP go_threads Number of OS threads created.# TYPE go_threads gaugego_threads 6# HELP process_cpu_seconds_total Total user and system CPU time spent in seconds.# TYPE process_cpu_seconds_total counterprocess_cpu_seconds_total 0.03125# HELP process_max_fds Maximum number of open file descriptors.# TYPE process_max_fds gaugeprocess_max_fds 1.6777216e+07# HELP process_open_fds Number of open file descriptors.# TYPE process_open_fds gaugeprocess_open_fds 105# HELP process_resident_memory_bytes Resident memory size in bytes.# TYPE process_resident_memory_bytes gaugeprocess_resident_memory_bytes 1.0088448e+07# HELP process_start_time_seconds Start time of the process since unix epoch in seconds.# TYPE process_start_time_seconds gaugeprocess_start_time_seconds 1.650767211e+09# HELP process_virtual_memory_bytes Virtual memory size in bytes.# TYPE process_virtual_memory_bytes gaugeprocess_virtual_memory_bytes 1.5495168e+07# HELP promhttp_metric_handler_requests_in_flight Current number of scrapes being served.# TYPE promhttp_metric_handler_requests_in_flight gaugepromhttp_metric_handler_requests_in_flight 1# HELP promhttp_metric_handler_requests_total Total number of scrapes by HTTP status code.# TYPE promhttp_metric_handler_requests_total counterpromhttp_metric_handler_requests_total{code="200"} 0promhttp_metric_handler_requests_total{code="500"} 0promhttp_metric_handler_requests_total{code="503"} 0复制代码
参考文档
3. 将 HTTPServer 部署至测试集群,并完成 Prometheus 配置
部署出现 error
go: github.com/prometheus/client_golang@v1.12.1: Get "https://goproxy.cn/github.com/prometheus/client_golang/@v/v1.12.1.mod": dial tcp 180.97.64.41:443: i/o timeout复制代码
指定网络重新构建
docker build --network host -f Dockerfile -t httpserver:0.10.1 .复制代码
修改 httpserver.yaml 文件的镜像版本号,重新应用
kubectl apply -f httpserver.yaml复制代码
4. 从 Promethus 界面中查询延时指标数据
划线
评论
复制
发布于: 刚刚阅读数: 2
版权声明: 本文为 InfoQ 作者【jjn0703】的原创文章。
原文链接:【http://xie.infoq.cn/article/738c6689430bff87e94dfca71】。
本文遵守【CC-BY 4.0】协议,转载请保留原文出处及本版权声明。

jjn0703
关注
Java工程师/终身学习者 2018.03.26 加入
USTC硕士/健身健美爱好者/Java工程师.


评论