一、同步打印日志中的坑
1.1 高并发场景下 logback 造成线程泄露
调用 logback 去打印日志的时候是会加锁的,加锁的位置在:
// ch.qos.logback.core.OutputStreamAppender#writeBytesprivate void writeBytes(byte[] byteArray) throws IOException {    if (byteArray != null && byteArray.length != 0) {        this.lock.lock();        try {            this.outputStream.write(byteArray);            if (this.immediateFlush) {                this.outputStream.flush();            }        } finally {            this.lock.unlock();        }
    }}
复制代码
这就意味着同一个 appender 的日志写是串行的,在高并发的场景下因为有锁的争用现象,所以看似很简单的一行日志,耗费的时间却不少。接下来我们在本地简单的模拟一下高并发的场景,并记录打一行日志的耗时是多少
public static void main(String[] args) { ExecutorService threadPool = new ThreadPoolExecutor(500, 750, 20, TimeUnit.MINUTES, new ArrayBlockingQueue<>(1), new ThreadFactoryBuilder().setNameFormat("test-log-thread").build(), new ThreadPoolExecutor.CallerRunsPolicy()); for (int i = 0; i < 750; i++) { LoggerExecutor commonExecutor = new LoggerExecutor(); threadPool.submit(commonExecutor); }}static class LoggerExecutor implements Runnable { @SneakyThrows @Override public void run() { while (true) { long start = System.currentTimeMillis(); logger.info("log info message at {}", System.currentTimeMillis()); long end = System.currentTimeMillis(); long time = end - start; System.out.println(time); } }}
复制代码
需要说明的是,现实中高并发的请求应当用一个线程池向另一个线程池反复提交任务来模拟,这里我们简化了这个过程。
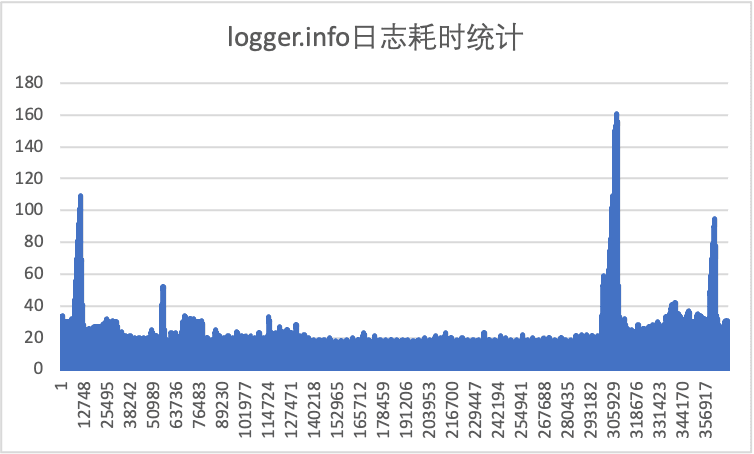
上图是我记录下来的 logger.info 的耗时曲线,从这张统计图上可以看到,当并发量上来之后锁争用的情况加剧,仅仅是打印一行 info 日志就可能花费 20-40ms(作为对比,在我的机器上单线程打印一行日志通常是 1-2ms),而且图上有比较明显的毛刺,打印日志的耗时超过了 100ms,毛刺的原因在于 OutputStream 在缓存区满了后要执行刷盘动作,但是在真正大流量应用中这种毛刺是致命的,可能导致 RPC 框架的线程池被吃光,正常业务服务的成功率下降。所以在高并发大流量的场景下 info 日志的打印一定要谨慎。
1.2 大量异常引发性能毛刺
在上一小节中我们提到,高并发场景下 info 日志要谨慎打印,一般我们只记录系统异常的日志。我们把刚才的代码片段做一个小的修改,改为调用 logger.error 打印日志,然后再统计下这行代码的耗时
// 驱动代码同1.1节,所以这里省略static class LoggerExecutor implements Runnable { @SneakyThrows @Override public void run() { while (true) { long start = System.currentTimeMillis(); //logger.info("log info message at {}", System.currentTimeMillis()); logger.error("log info message occurs error: {}", new RuntimeException()); long end = System.currentTimeMillis(); long time = end - start; System.out.println(time); } }}
复制代码
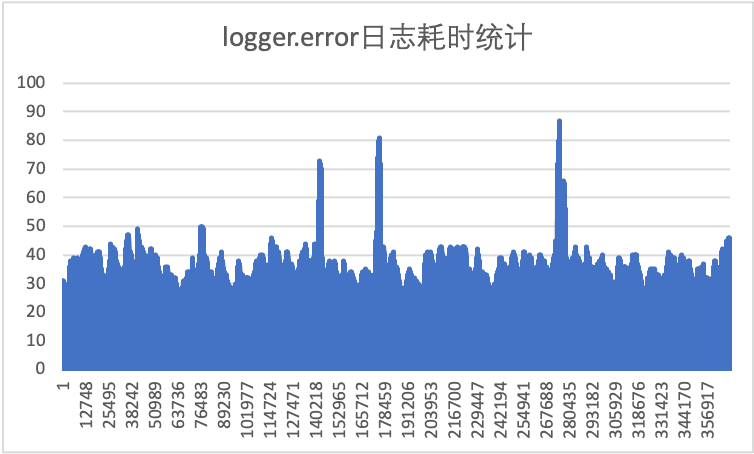
与 1.1 节相比,一个很明显的变化就是 error 日志的执行平均耗时到了 40-50ms,要比 1.1 节中的 info 日志慢不少,这是为什么呢?原因就在于调用 logger.error(String, Throwable)时为了打印堆栈加载了每个调用节点的 class,代码在:
//ch.qos.logback.classic.spi.PackagingDataCalculator#computeBySTEPprivate ClassPackagingData computeBySTEP(StackTraceElementProxy step, ClassLoader lastExactClassLoader) { String className = step.ste.getClassName(); ClassPackagingData cpd = cache.get(className); if (cpd != null) { return cpd; } // 注意这行代码 Class type = bestEffortLoadClass(lastExactClassLoader, className); String version = getImplementationVersion(type); String codeLocation = getCodeLocation(type); cpd = new ClassPackagingData(codeLocation, version, false); cache.put(className, cpd); return cpd;}
复制代码
在 bestEffortLoadClass 中则会尝试类加载:
private Class bestEffortLoadClass(ClassLoader lastGuaranteedClassLoader, String className) {    Class result = loadClass(lastGuaranteedClassLoader, className);    if (result != null) {        return result;    }    ClassLoader tccl = Thread.currentThread().getContextClassLoader();    if (tccl != lastGuaranteedClassLoader) {        result = loadClass(tccl, className);    }    if (result != null) {        return result;    }
    try {        return Class.forName(className);    } catch (ClassNotFoundException e1) {        return null;    } catch (NoClassDefFoundError e1) {        return null;    } catch (Exception e) {        e.printStackTrace(); // this is unexpected        return null;    }}
复制代码
// ch.qos.logback.classic.spi.PackagingDataCalculator#loadClassprivate Class loadClass(ClassLoader cl, String className) { if (cl == null) { return null; } try { return cl.loadClass(className); } catch (ClassNotFoundException e1) { return null; } catch (NoClassDefFoundError e1) { return null; } catch (Exception e) { e.printStackTrace(); // this is unexpected return null; }}
复制代码
java.lang.ClassLoader#loadClass(java.lang.String)这个方法就是我们熟知的加载类的接口,其实会在 className 维度加锁。到这里为什么 logger.error 比 logger.info 慢多大家应该就猜到了,logger.error 会打印出异常的堆栈,在高并发的场景下如果某个接口频繁抛异常,那在打印 error 日志的时候要各个线程要先去加载异常堆栈上各个类信息,产生锁竞争,然后才会在 appender 维度排队。一个常见的现实场景是下游服务限流或者直接宕机了,容易因为 logback 引发系统的毛刺。
二、异步日志配置不当造成线程泄露
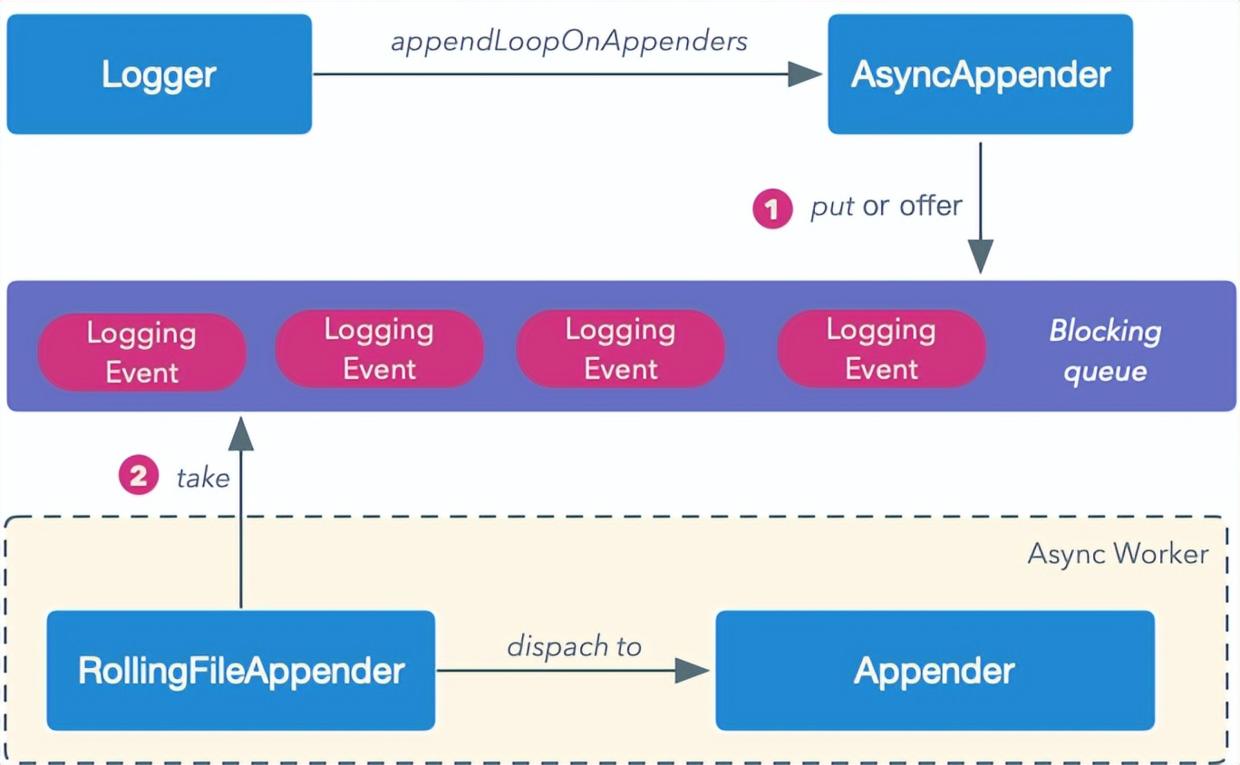
其实在高并发的场景下,一般都会将日志配置为异步打印,其原理大概如下图所示:
AsyncAppender 将 Logging Event 扔到一个队列里,然后会有一个单独的线程从队列中消费 LoggingEvent,并派发到具体要干活的 Appender 中,因为避免了直接直接调用 writeBytes,所以性能应该有非常大的提升。我们对 logback 的配置稍作改动,采取异步的方式打印日志:
<appender name="FILE" class="ch.qos.logback.core.FileAppender"> <file>/Users/idealism/Desktop/log.txt</file> <encoder> <pattern>%logger{35} - %msg%n</pattern> </encoder></appender><appender name="ASYNC" class="ch.qos.logback.classic.AsyncAppender"> <appender-ref ref="FILE" /></appender><root level="DEBUG"> <appender-ref ref="ASYNC"/> </root></configuration>
复制代码
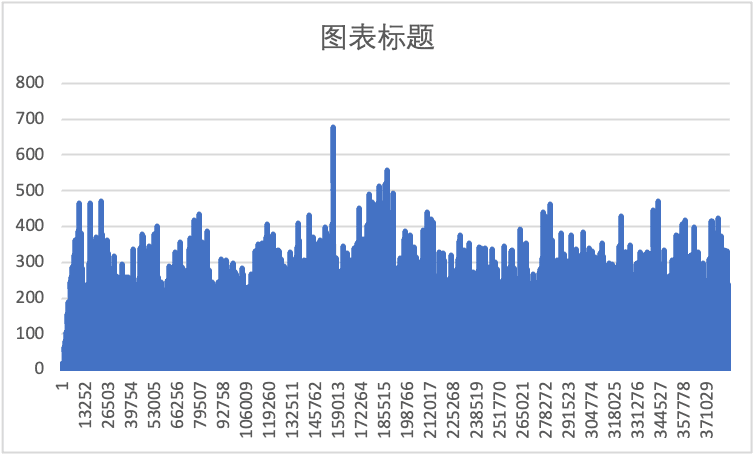
并采样了每次打印日志的耗时如下图所示:
令人震惊的一幕出现了,在并发量比较大的场景下,异步打印日志的的性能与同步相比竟然差了 10 倍!这是为什么呢?上文说到,logback 异步日志的实现原理是一个生产者-消费者模型,问题在于在大流量的场景下,分配线程这个单线程的消费能力是赶不上生产能力的,最后导致所有的线程在日志打印的阻塞队列上排队。此时通过 arthas 也可以看到线程的排队情况,如果这是线上的业务系统,业务线程早被日志的阻塞队列吃光了,会引起业务响应异常
[arthas@9341]$ threadThreads Total: 780, NEW: 0, RUNNABLE: 13, BLOCKED: 745, WAITING: 4, TIMED_WAITING: 3, TERMINATED: 0, Internal threads: 15ID NAME GROUP PRIORI STATE %CPU DELTA_ TIME INTER DAEMON10 AsyncAppender-Worke main 5 RUNNAB 43.01 0.090 0:13.7 false true77 arthas-command-exec system 5 RUNNAB 4.9 0.010 0:0.02 false true39 test-log-thread main 5 BLOCKE 0.75 0.001 0:0.14 false false71 test-log-thread main 5 BLOCKE 0.71 0.001 0:0.15 false false37 test-log-thread main 5 BLOCKE 0.71 0.001 0:0.14 false false74 test-log-thread main 5 BLOCKE 0.69 0.001 0:0.15 false false67 test-log-thread main 5 BLOCKE 0.69 0.001 0:0.14 false false-1 C2 CompilerThread2 - -1 - 0.68 0.001 0:1.68 false true69 test-log-thread main 5 BLOCKE 0.66 0.001 0:0.15 false false55 test-log-thread main 5 BLOCKE 0.66 0.001 0:0.14 false false38 test-log-thread main 5 BLOCKE 0.65 0.001 0:0.15 false false36 test-log-thread main 5 BLOCKE 0.65 0.001 0:0.14 false false28 test-log-thread main 5 BLOCKE 0.65 0.001 0:0.15 false false50 test-log-thread main 5 BLOCKE 0.65 0.001 0:0.14 false false36 test-log-thread main 5 BLOCKE 0.64 0.001 0:0.14 false false
复制代码
三、其他问题
除了上面提到的几个在高并发大流量场景下特有的坑外,还有一些其他的坑这里列一下,因为网上的博客比较多了,这里不再赘述
https://www.elietio.xyz/posts/f6b1711c.html《低版本 bug 导致 totalSizeCap 参数不生效》
logback 版本过低导致 SizeAndTimeBasedRollingPolicy 不生效的问题
四、最佳实践
应当遵循以下几个原则:
**【最佳实践一】**日志工具对象的 logger 应当声明为 private static final
声明为 private 是为了安全性考虑,防止 logger 被其他类非法使用
声明为 static 和 final 则是因为在类的声明周期内无需变更 logger,并且占用内存也更小
**【最佳实践二】**日志字符串通过"+"拼接即占用了额外的内存,也不直观,应当使用占位符
**【最佳实践三】**日志内容和日志级别相符合
debug 和 trace 一般是开发者调试程序使用,线上应关闭这类日志
info 日志应当记录重要且无风险的信息,如上下文初始化,定时任务开始执行或者远程连接建立等场合
warn 日志应当记录可能有风险,但是不会影响系统继续运行的错误,如系统参数配置错误,用户请求参数不正确等。或者是在一些耗时异常的场景,如一次请求超时,一次 sql 执行超过 2 秒等
error 日志用于程序出错打印堆栈,不应该输出程序问题之外的其他信息
**【最佳实践四】**高并发系统应少打或不打 info 日志,且应当配置为异步日志,当阻塞队列满时采取丢日志的策略,以保证业务系统正常运行


评论