在配置系统监控的时候,是不是即使绞尽脑汁监控的也还是不够全面,或者不知如何获取想要的指标。
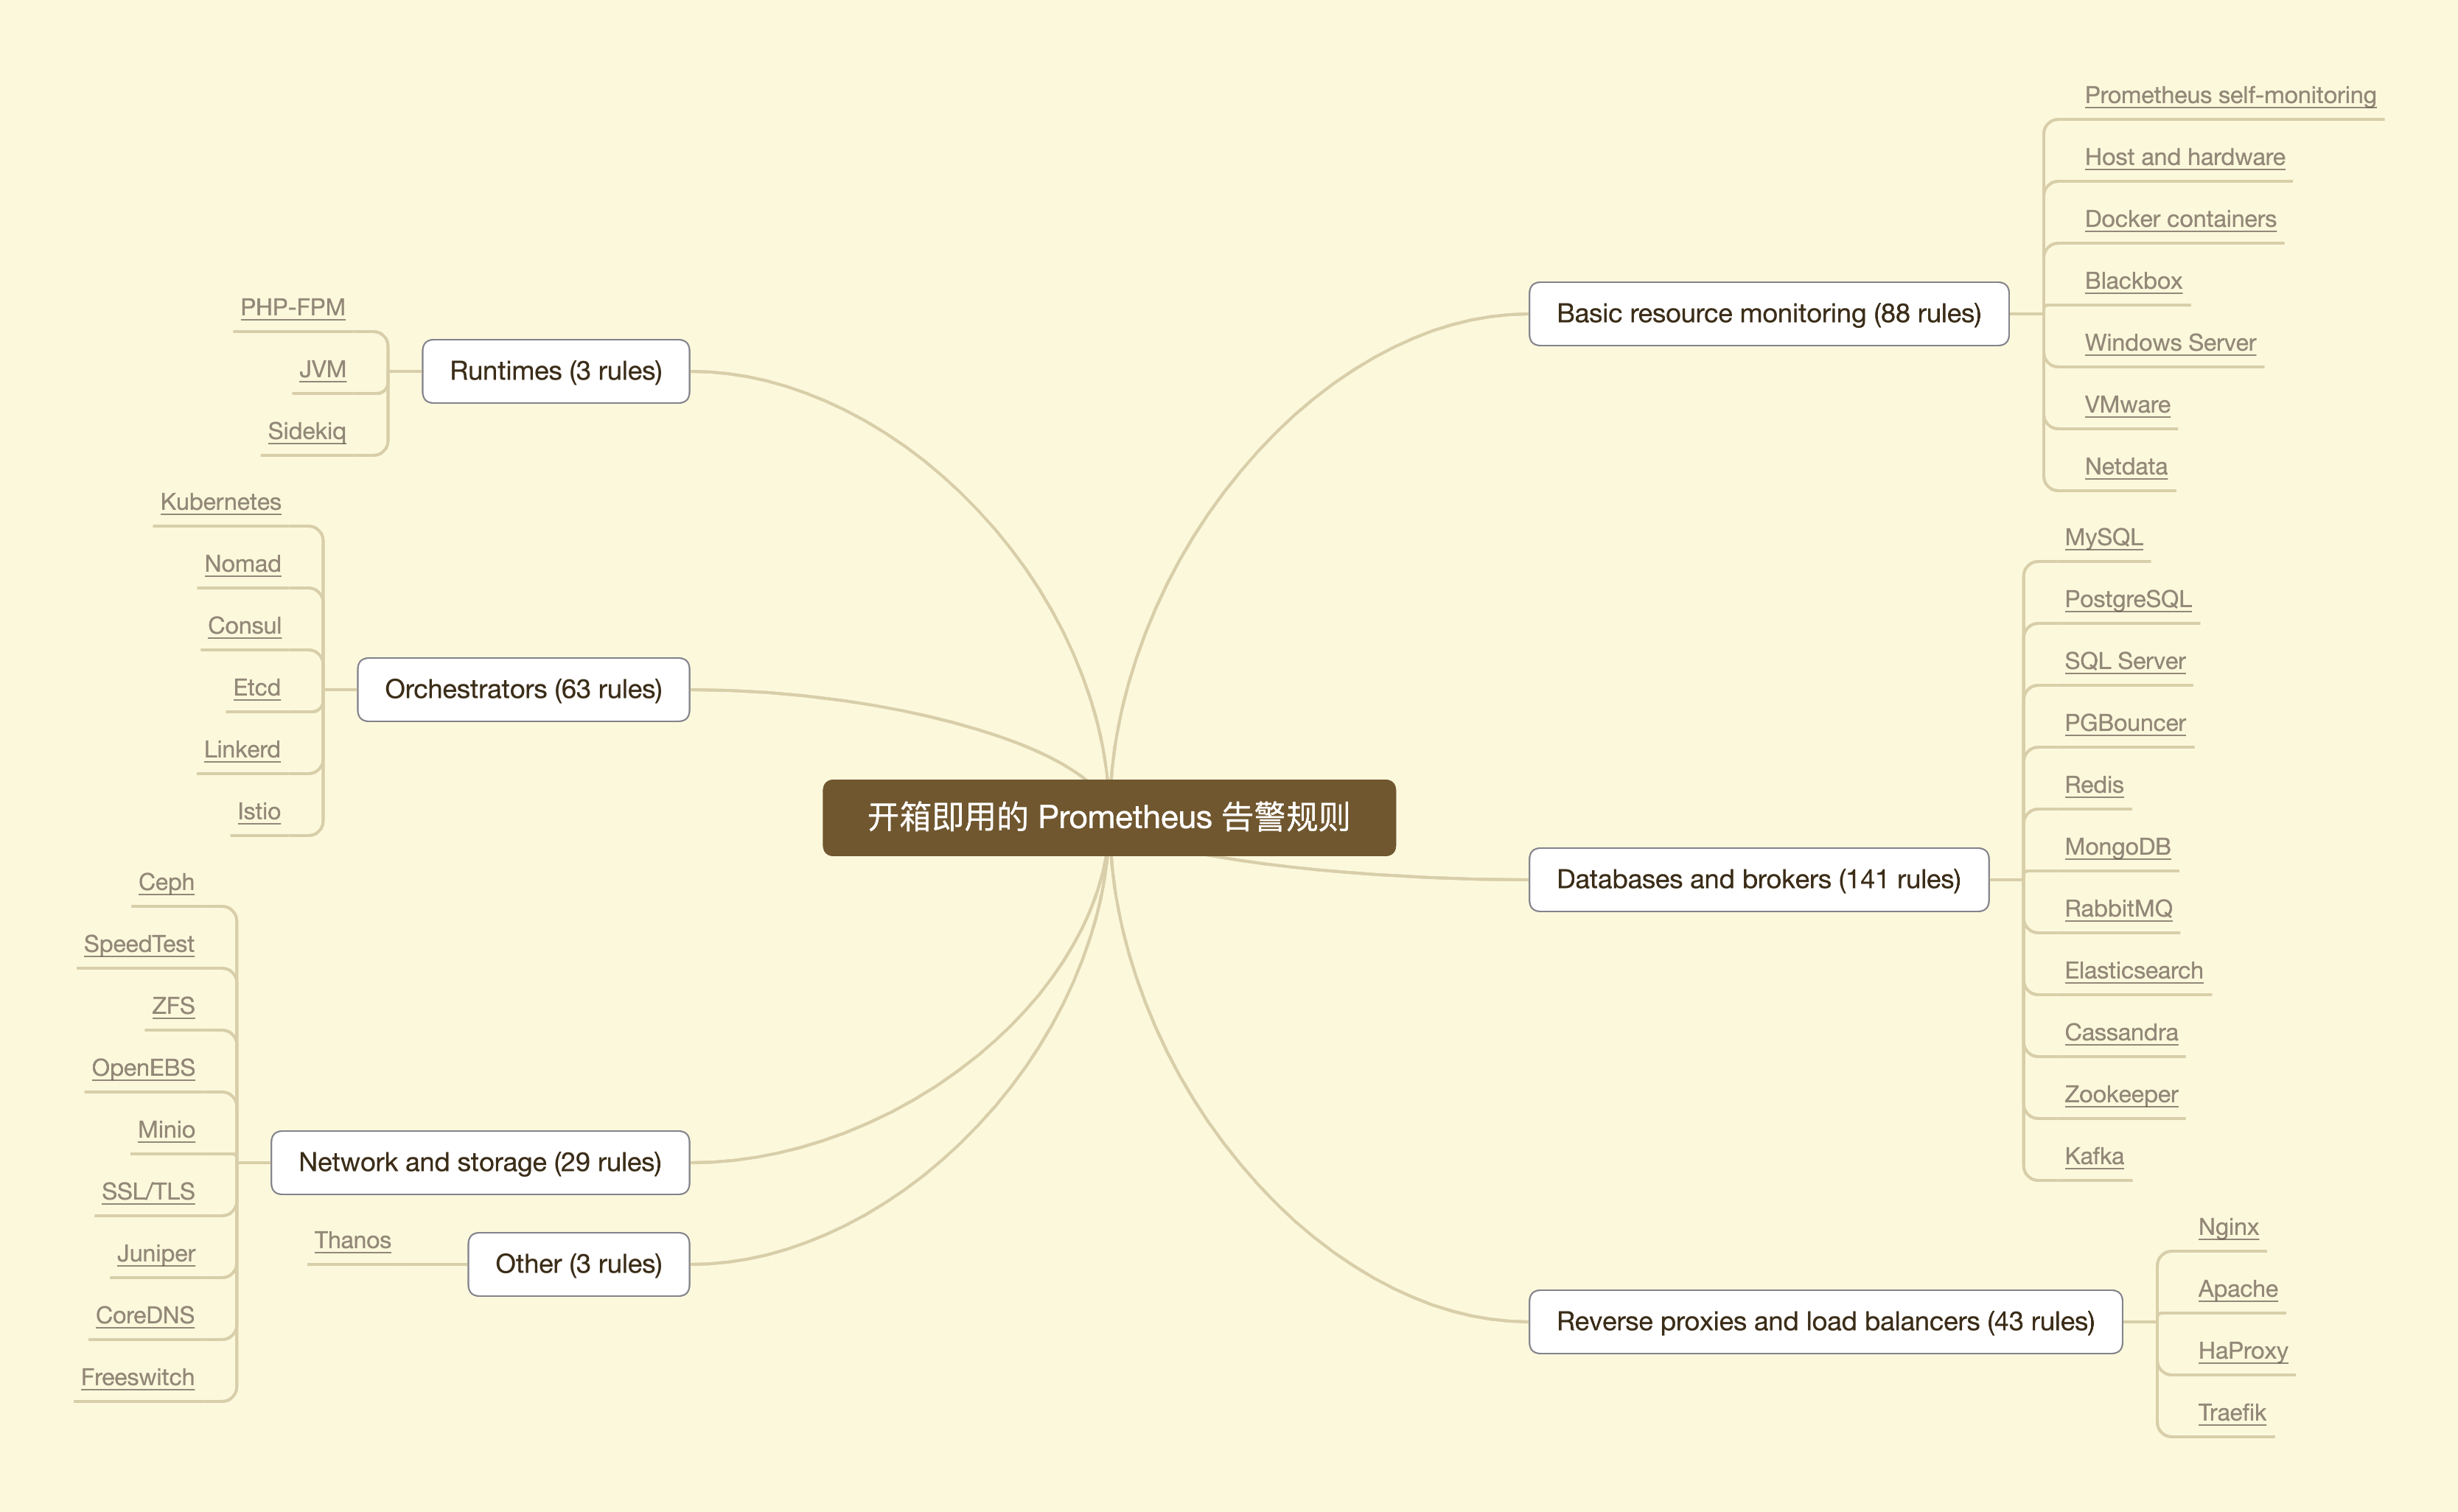
Awesome Prometheus alerts 维护了一套开箱即用的 Prometheus 告警规则集合,有 300 多个告警规则。同时,还是说明如何获取对应的指标。这些规则,对每个 Prometheus 都是通用的。
涉及如主机、硬件、容器等基础资源,到数据库、消息代理、运行时、反向代理、负责均衡器,运行时、服务编排,甚至是网络层面和 Prometheus 自身和集群。
Prometheus 的安装和配置不做赘述,配置可以看这里。下面简单看下几个常用规则
主机和硬件资源
主机和硬件资源的告警依赖 node-exporter 输出的指标。例如:
内存不足
可用内存低于阈值 10% 就会触发告警。
- alert: HostOutOfMemory expr: node_memory_MemAvailable_bytes / node_memory_MemTotal_bytes * 100 < 10 for: 2m labels: severity: warning annotations: summary: Host out of memory (instance {{ $labels.instance }}) description: "Node memory is filling up (< 10% left)\n VALUE = {{ $value }}\n LABELS = {{ $labels }}"
复制代码
主机异常的网络吞吐
最近两分钟入站的流量超过 100m。
rate 语法见这里。
- alert: HostUnusualNetworkThroughputIn expr: sum by (instance) (rate(node_network_receive_bytes_total[2m])) / 1024 / 1024 > 100 for: 5m labels: severity: warning annotations: summary: Host unusual network throughput in (instance {{ $labels.instance }}) description: "Host network interfaces are probably receiving too much data (> 100 MB/s)\n VALUE = {{ $value }}\n LABELS = {{ $labels }}"
复制代码
Mysql
Mysql 的告警依赖 prometheus/mysqld_exporter 输出的指标。
连接数过多
Mysql 实例的连接数最近一分钟的连接数超过最大值的 80% 触发告警
- alert: MysqlTooManyConnections(>80%) expr: avg by (instance) (rate(mysql_global_status_threads_connected[1m])) / avg by (instance) (mysql_global_variables_max_connections) * 100 > 80 for: 2m labels: severity: warning annotations: summary: MySQL too many connections (> 80%) (instance {{ $labels.instance }}) description: "More than 80% of MySQL connections are in use on {{ $labels.instance }}\n VALUE = {{ $value }}\n LABELS = {{ $labels }}"
复制代码
慢查询
最近一分钟慢查询数量大于 0 时触发。
- alert: MysqlSlowQueries expr: increase(mysql_global_status_slow_queries[1m]) > 0 for: 2m labels: severity: warning annotations: summary: MySQL slow queries (instance {{ $labels.instance }}) description: "MySQL server mysql has some new slow query.\n VALUE = {{ $value }}\n LABELS = {{ $labels }}"
复制代码
运行时 JVM
JVM 的运行时告警,居然只有可怜巴巴的一个。堆空间占用超过 80% 触发告警。
依赖 java-client 输出的指标。
- alert: JvmMemoryFillingUp expr: (sum by (instance)(jvm_memory_used_bytes{area="heap"}) / sum by (instance)(jvm_memory_max_bytes{area="heap"})) * 100 > 80 for: 2m labels: severity: warning annotations: summary: JVM memory filling up (instance {{ $labels.instance }}) description: "JVM memory is filling up (> 80%)\n VALUE = {{ $value }}\n LABELS = {{ $labels }}"
复制代码
Kubernetes
Kubernetes 相关的告警规则有 33 个,比较丰富。
摘个比较常见的:容器 OOM 告警。
- alert: KubernetesContainerOomKiller expr: (kube_pod_container_status_restarts_total - kube_pod_container_status_restarts_total offset 10m >= 1) and ignoring (reason) min_over_time(kube_pod_container_status_last_terminated_reason{reason="OOMKilled"}[10m]) == 1 for: 0m labels: severity: warning annotations: summary: Kubernetes container oom killer (instance {{ $labels.instance }}) description: "Container {{ $labels.container }} in pod {{ $labels.namespace }}/{{ $labels.pod }} has been OOMKilled {{ $value }} times in the last 10 minutes.\n VALUE = {{ $value }}\n LABELS = {{ $labels }}"
复制代码
SSL 证书过期
通过 输出的指标,可以监控证书过期:未来 7 天 有证书过期便会触发告警。
- alert: SslCertificateExpiry(<7Days) expr: ssl_verified_cert_not_after{chain_no="0"} - time() < 86400 * 7 for: 0m labels: severity: warning annotations: summary: SSL certificate expiry (< 7 days) (instance {{ $labels.instance }}) description: "{{ $labels.instance }} Certificate is expiring in 7 days\n VALUE = {{ $value }}\n LABELS = {{ $labels }}"
复制代码
今天列出来的也仅仅是冰山一角,而且用户也可以贡献出更多的规则。


评论