写点什么

架构师训练营第七周课后作业

用户头像
Gosling
关注
发布于: 2020 年 11 月 08 日
1.性能压测的时候,随着并发压力的增加,系统响应时间和吞吐量如何变化,为什么?

在现在的分时操作系统中,每个用户的并发请求都由我们的容器分配一个线程来执行,而每个线程在分时操作系统下是竞争 CPU 资源来执行的,当并发数增加时会出现以下情况:


系统响应时间

系统响应时间会随着并发压力的增加而增加,因为我们的 CPU 核心数是有限的,当并发增加时,单个线程在单位时间内可以获得 CPU 执行的时间就变少了,许多线程会逐步进入排队状态,这时候单个线程的总执行时间就会增加。


吞吐量

吞吐量的大小在前期会随着并发的增加而增加,但是当达到一个平衡点时,整体吞吐量会随着并发的增加而下降,这个平衡点或者说是拐点是我们寻求的最佳性能配置点,一般我们通过压力测试得出一个服务器最适合在多少的并发下提供服务。

前期在并发还不大时,单位时间内可以调度执行的线程会随着并发的增加而增加,这时消耗的内存还不多,在承受范围内,但是当并发数不断增加时,内存会被不断消耗,每个活动的线程需要向操作系统申请栈空间,这部分是消耗内存的,例如 Java 程序可以通过 JVM 启动参数来设置每个线程的内存大小。当内存不足时,需要从磁盘上置换虚拟内存进行使用。这时候的系统负荷已经相当高了,每次 CPU 在做线程切换都要中断消耗时间,在大量线程的情况下,这样的切换会变得频繁。最后触发 OOM,把 JVM 进程直接压爆,系统崩溃。

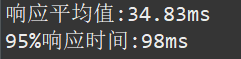
2.用你熟悉的编程语言写一个 Web 性能压测工具,输入参数:URL,请求总次数,并发数。输出参数:平均响应时间,95% 响应时间。用这个测试工具以 10 并发、100 次请求压测 www.baidu.com。

工具类

public class LoadTestTool {	private ExecutorService executorService;		private AtomicInteger count = new AtomicInteger(0);		private int threadNum = 0;	private String url;	private int totalReqNum = 0;		public LoadTestTool(String url, int threadNum, int totalReqNum) {		init(url,threadNum,totalReqNum);	}		private void init(String url, int threadNum, int totalReqNumm) {		this.threadNum = threadNum;		this.url = url;		this.totalReqNum = totalReqNumm;		ThreadFactory threadFactory = new ThreadFactoryBuilder()		        .setNameFormat("web-load-%d").build();				this.executorService = new ThreadPoolExecutor(threadNum, threadNum,		        0L, TimeUnit.MILLISECONDS,		        new LinkedBlockingQueue<Runnable>(1024), threadFactory, new ThreadPoolExecutor.AbortPolicy());;	}		public void runLoadTest() throws IOException {		for(int i = 0;i < this.totalReqNum ;i++) {			this.executorService.execute(new WorkRunnable(this.url));		}	}		public void shutDown() {		this.executorService.shutdown();	}		public boolean isFinish() {		return this.executorService.isTerminated();	}}
复制代码

工作线程类

public class WorkRunnable implements Runnable{
private HttpURLConnection conn; private String path; public WorkRunnable(String path) throws IOException { this.path = path; URL url = new URL(this.path); conn = (HttpURLConnection) url.openConnection(); conn.setRequestMethod("GET"); } @Override public void run() { Long start = System.currentTimeMillis(); try { conn.connect(); } catch (IOException e) { e.printStackTrace(); } InputStream is = null; BufferedReader reader = null; int resCode = 0; try { resCode = conn.getResponseCode(); } catch (IOException e) { e.printStackTrace(); } if (resCode == HttpURLConnection.HTTP_OK) { try { is = conn.getInputStream(); } catch (IOException e) { e.printStackTrace(); } try { reader = new BufferedReader(new InputStreamReader(is, "UTF-8")); } catch (UnsupportedEncodingException e) { e.printStackTrace(); } StringBuffer sb = new StringBuffer(); String strRead = null; try { while ((strRead = reader.readLine()) != null) { sb.append(strRead); } } catch (IOException e) { e.printStackTrace(); } }else { System.out.println("请求失败"); } Long end = System.currentTimeMillis(); GlobalStatistic.time.add(end - start); }}
复制代码

统计器类(为了简化结果的收集,使用了静态的属性)

public class GlobalStatistic {	public static CopyOnWriteArrayList<Long> time = new CopyOnWriteArrayList<>();}
复制代码

测试方法

int threadNum = 10;		int totalRequest = 100;				LoadTestTool tool = new LoadTestTool("http://www.baidu.com",threadNum,totalRequest);		tool.runLoadTest();		tool.shutDown();		while(!tool.isFinish()) {			Thread.sleep(1);		}		Double avg = GlobalStatistic.time.stream().collect(Collectors.averagingLong(i -> i));		System.out.println("响应平均值:"+avg+"ms");				int percent95 = (totalRequest * 95 / 100);				long e95 = GlobalStatistic.time.stream().sorted().collect(Collectors.toList()).get(percent95);		System.out.println("95%响应时间:"+e95+"ms");
复制代码

结果输出


用户头像

Gosling

关注

这个家伙很懒,只留下这一句话 2017.10.28 加入

还未添加个人简介

评论

发布
暂无评论
架构师训练营第七周课后作业