import com.spire.presentation.FileFormat;import com.spire.presentation.Presentation;import com.spire.presentation.SlideSizeType;import com.spire.presentation.TextLineStyle;import com.spire.presentation.charts.ChartType;import com.spire.presentation.charts.IChart;import com.spire.presentation.charts.entity.ChartDataLabel;import com.spire.presentation.drawing.FillFormatType;
import java.awt.*;import java.awt.geom.Rectangle2D;
public class ScatterChart { public static void main(String[] args) throws Exception{ //创建Presentation类的实例 Presentation presentation = new Presentation(); presentation.getSlideSize().setType(SlideSizeType.SCREEN_16_X_9);
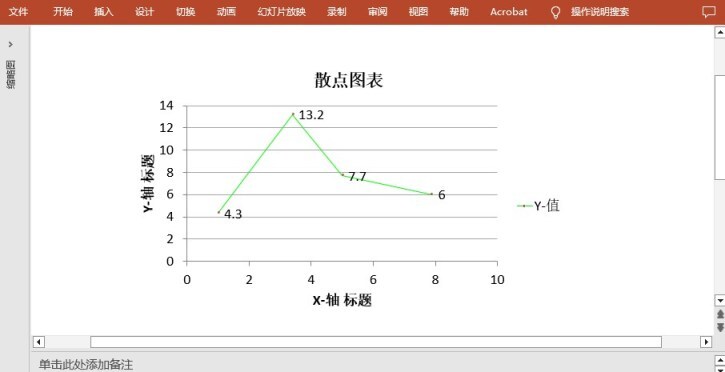
//添加散点图表到第一张幻灯片 IChart chart = presentation.getSlides().get(0).getShapes().appendChart(ChartType.SCATTER_MARKERS,new Rectangle2D.Float(180, 80, 550, 320),false);
//设置图表标题 chart.getChartTitle().getTextProperties().setText("散点图表"); chart.getChartTitle().getTextProperties().isCentered(true); chart.getChartTitle().setHeight(20f); chart.hasTitle(true);
//设置图表数据源 Double[] xData = new Double[] { 1.0, 3.4, 5.0, 7.9 }; Double[] yData = new Double[] { 4.3, 13.2, 7.7, 6.0 }; chart.getChartData().get(0,0).setText("X-值"); chart.getChartData().get(0,1).setText("Y-值"); for (int i = 0; i < xData.length; i++) { chart.getChartData().get(i+1,0).setValue(xData[i]); chart.getChartData().get(i+1,1).setValue(yData[i]); }
//设置系列标签 chart.getSeries().setSeriesLabel(chart.getChartData().get("B1","B1"));
//设置X和Y轴值 chart.getSeries().get(0).setXValues(chart.getChartData().get("A2","A5")); chart.getSeries().get(0).setYValues(chart.getChartData().get("B2","B5"));
//添加数据标签 for (int i = 0; i < 4; i++) { ChartDataLabel dataLabel = chart.getSeries().get(0).getDataLabels().add(); dataLabel.setLabelValueVisible(true); }
//设置主轴标题和次轴标题 chart.getPrimaryValueAxis().hasTitle(true); chart.getPrimaryValueAxis().getTitle().getTextProperties().setText("X-轴 标题"); chart.getSecondaryValueAxis().hasTitle(true); chart.getSecondaryValueAxis().getTitle().getTextProperties().setText("Y-轴 标题");
//设置网格线 chart.getSecondaryValueAxis().getMajorGridTextLines().setFillType(FillFormatType.SOLID); chart.getSecondaryValueAxis().getMajorGridTextLines().setStyle(TextLineStyle.THIN_THIN); chart.getSecondaryValueAxis().getMajorGridTextLines().getSolidFillColor().setColor(Color.GRAY); chart.getPrimaryValueAxis().getMajorGridTextLines().setFillType(FillFormatType.NONE);
//设置数据点线 chart.getSeries().get(0).getLine().setFillType(FillFormatType.SOLID); chart.getSeries().get(0).getLine().setWidth(0.1f); chart.getSeries().get(0).getLine().getSolidFillColor().setColor(Color.GREEN);
//保存文档 presentation.saveToFile("ScatterChart.pptx", FileFormat.PPTX_2013); presentation.dispose(); }}


评论